 Precipitaciones durante 2021 en Santa Cruz y Sur de Chubut
 Activador Ruminal de elaboración Casera
 Libro: Servicios Ecosistémicos y Biodiversidad de los Recursos Naturales de Santa Cruz
 Aprovechamiento de pasturas en estado reproductivo y desempeño de corderas en la Patagonia Austral
 Hoja de Nothofagus antarctica (Ñire)
 Catálogo de Padres Corriedale Año 2022
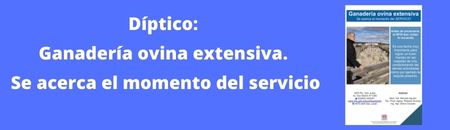 Díptico: ganadería ovina extensiva. Se acerca el momento del servicio
Procesando la solicitud,
Por favor aguarde ...
Usted esta aqui: Agrometeorología > Estadísticas > Temperaturas mínimas absolutas mensuales (en casilla) en grados centígrados > Estación meteorologica: Trevelin (Agroforestal)
| Año | ENE | FEB | MAR | ABR | MAY | JUN | JUL | AGO | SEP | OCT | NOV | DIC | ABSOLUTA |
|---|---|---|---|---|---|---|---|---|---|---|---|---|---|
| 2021 | -7 | -8.1 | -4.3 | -7.7 | -2 | -1 | -8.1 | ||||||
| 2020 | 0.7 | -1.5 | -5 | -5 | -4.7 | -5.5 | -7.4 | -7.2 | -7.4 | ||||
| 2019 | -3.1 | -4.1 | -5.7 | -7.8 | -8 | -6.2 | -5.9 | -7 | -5.6 | -1.7 | 0.1 | -8 | |
| 2018 | -0.4 | -2.8 | -5.3 | -5.2 | -7.7 | -4.8 | -4.2 | -2 | -0.5 | -7.7 | |||
| 2017 | 2.9 | 1 | -5.3 | -6.2 | -16.1 | -3.9 | -6.1 | -3.7 | -1.7 | 0 | -16.1 | ||
| 2016 | -0.6 | -0.3 | -3.7 | -6.6 | -8.1 | -6.6 | -11.2 | -5 | -5.5 | -4.4 | -3.1 | 0.4 | -11.2 |
| 2015 | 3.1 | 0 | -0.6 | -3.7 | -4.3 | -8.7 | -4.5 | -5.4 | -4.5 | -4.7 | -2.3 | -0.6 | -8.7 |
| 2014 | 0 | -0.9 | -4.5 | -4.4 | -5.5 | -5.7 | -7.4 | -3.9 | -3.1 | -3 | -2.1 | -2.1 | -7.4 |
| 2013 | 2.5 | 0.7 | -4.4 | -6.2 | -4.5 | -5.7 | -7.7 | -8.6 | -4.8 | -4 | -4.4 | 0.4 | -8.6 |
| 2012 | 1.4 | -1.8 | -2.9 | -8.2 | -8 | -10.2 | -6.4 | -6.6 | -4.4 | 5.6 | -1.8 | 1 | -10.2 |
| 2011 | 3.1 | 1.6 | 0.9 | -3.7 | -7 | -8.9 | -9 | -8.1 | -4.5 | -4.1 | -1.8 | -2.8 | -9 |
| 2010 | 3.4 | 3 | 2.5 | -1.6 | -5.8 | -6.8 | -6.2 | -8 | -5.8 | -1.5 | 0.8 | 0.6 | -8 |
| 2009 | 0.1 | 1.2 | -3.7 | -2.9 | -8.4 | -3.7 | -6.9 | -4.1 | -5.2 | -3.2 | -0.9 | 1.1 | -8.4 |
| 2008 | -1.9 | -1.7 | -4.1 | -7 | -7.3 | -6.4 | -9.7 | -4.5 | -5.1 | -0.6 | 0 | -1.2 | -9.7 |
| 2007 | 0 | -1.1 | -2.4 | -4.4 | -10.3 | -8.3 | -11.7 | -12.8 | -6.5 | 8.6 | -2.6 | -1 | -12.8 |
| 2006 | -0.3 | -1.6 | -2.1 | -8.1 | -8.7 | -4.2 | -12.1 | -8.6 | -8.8 | 1.2 | -2.8 | -2.2 | -12.1 |
| 2005 | -8.2 | -4.3 | -3.1 | -1.9 | -8.2 |